Dashboards
Overview
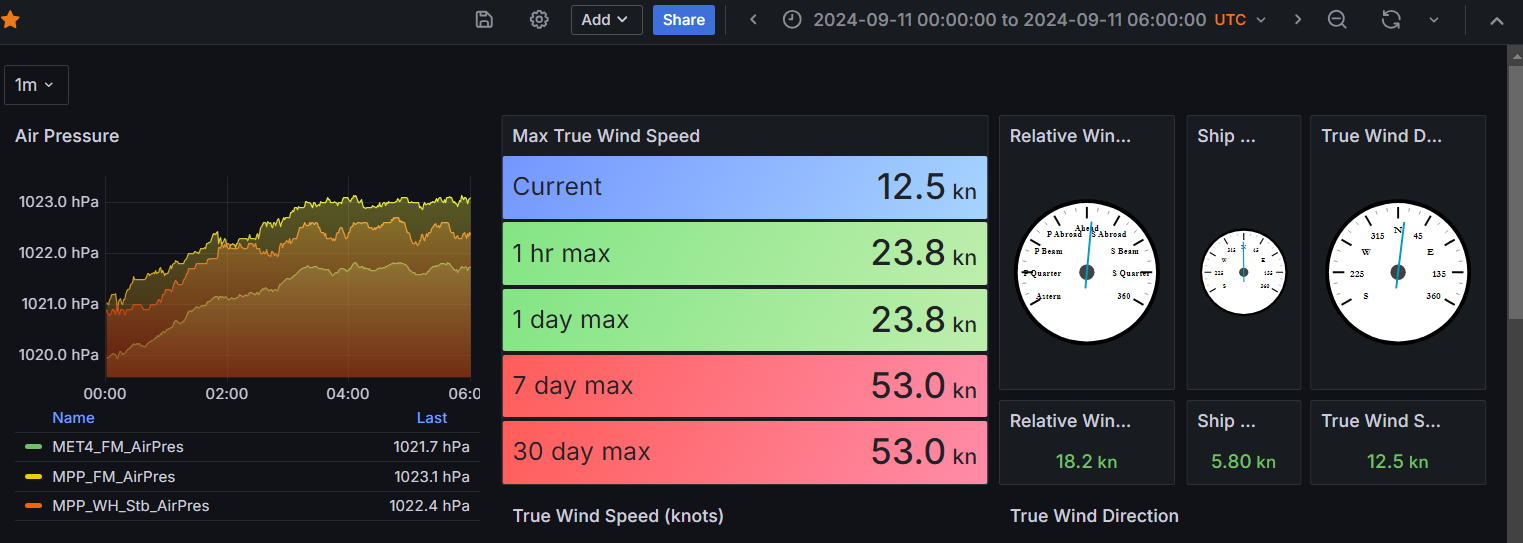
While aboard R/V Falkor (too) real-time data is viewable via a variety of grafana dashboards.
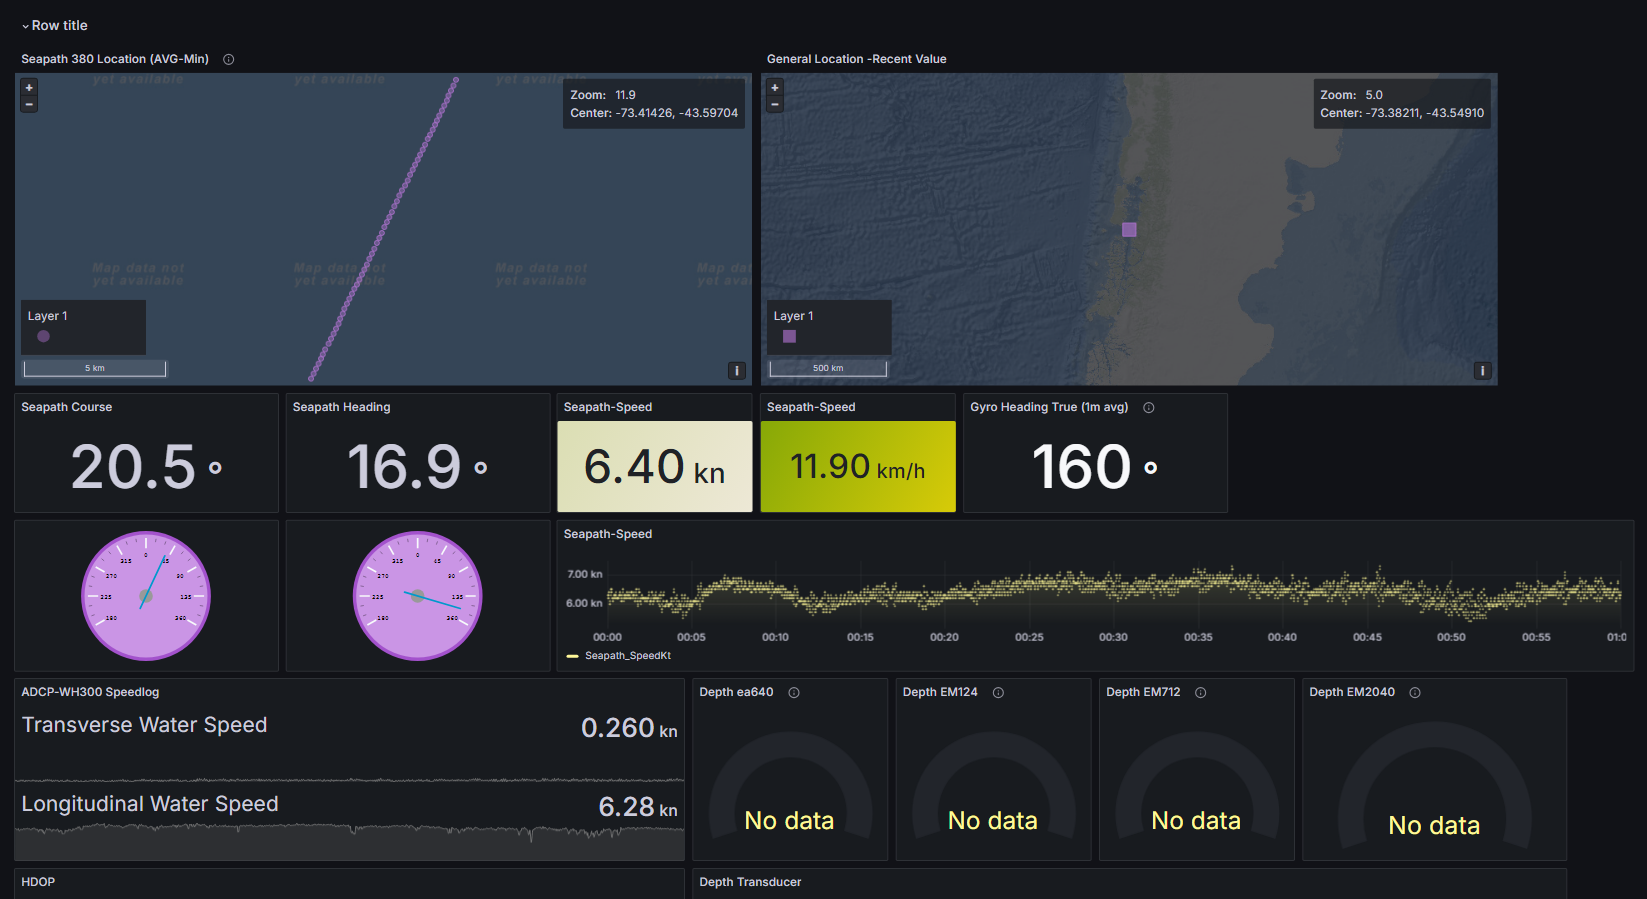
- For an overview of real-time data related to the Falkor (too)
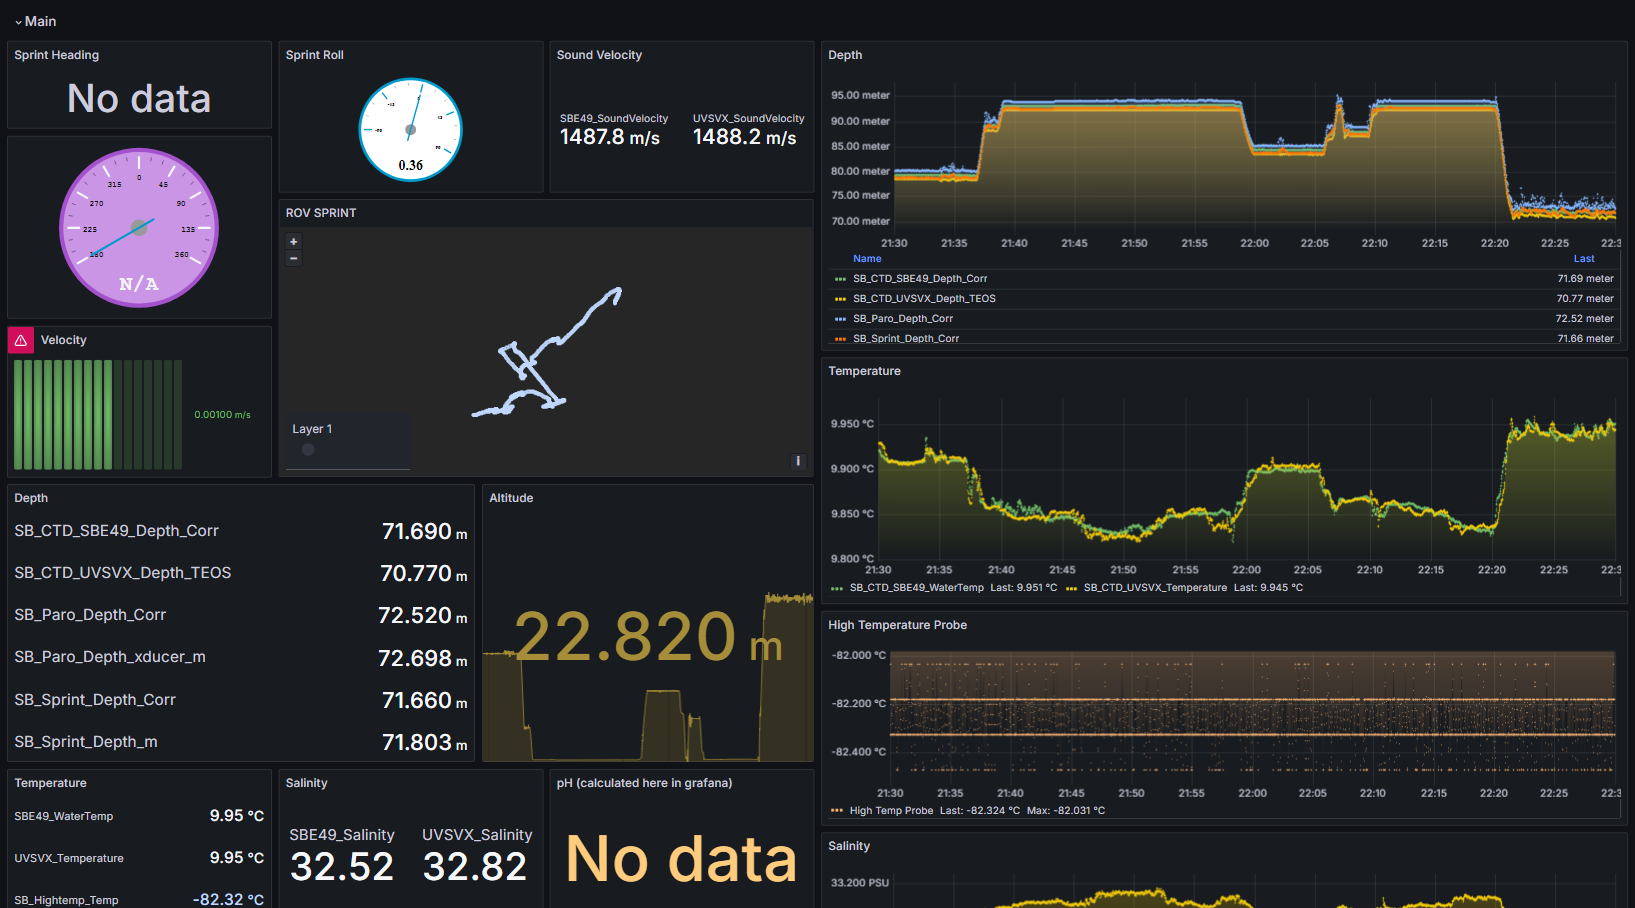
- For an overview of real-time data from ROV SuBastian
Dashboards of interest
Cruise Specific Dashboards
It is possible to have a dashboard created specific to your cruise. This is best requested during the cruise planning process but can also be done while onboard. Your Marine Technicans will work with you during the mobilization or transit to for configuration specifics.
Quick-Facts
Dashboards are set to show recent time periods. Each dashboard may show a different amount of time. The time span can be controlled for viewing in the upper right-hand side. When adjusted, the window for graphs will adjust. Some dashboards have been given the ability to bucket data based on a window choice. This dropdown, if available is in the upper left corner. Some calculations are for set time frames and are unaffected by this choice.
If you set the dashboard for too large of a time range, you will receive an error and the dashboard will only partially populate. If this occurs, you should reduce the time range.
Dashboards can be accessed by direct link.
All times are in UTC, not shiptime.
Navigate Between Dashboards
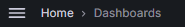
- The top left corner shows what dashboard you are currently in. To return to the dashboards, click on the “Dashboards” link.
- You will be taken to a list of all the dashboards in alphabetical order.
SuBastian dashboards are in the “SuBastian” folder.
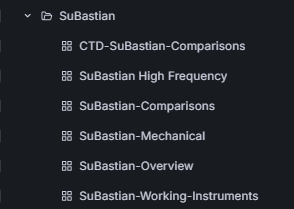
Falkor (too) dashboards are listed as stand alone.
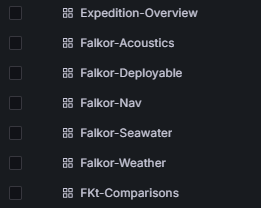
- Click on your desired dashboard and explore all of the graphs.
Changing Time Span and Data Density of Dashboards
Quick Ranges
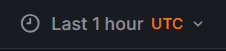
When you first enter a dashboard, the default time range is usually an hour. In the top right corner, you can see what timeframe your dashboard is set for.
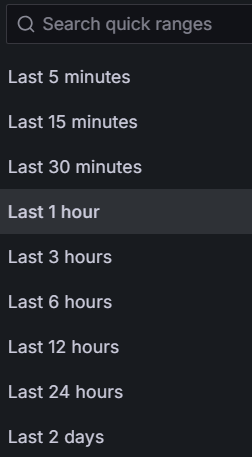
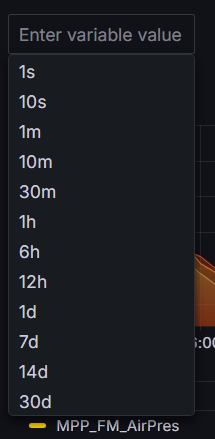
If you click the dropdown, you are shown quick ranges which range from present time to the past.
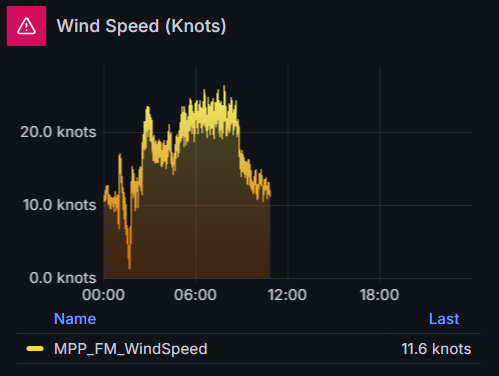
Truncated Graphs
You may find if you set the time range too high, an error will appear in the top left hand corner and some of the data will not graph. If this happens, you should shorten the time range or adjust the data density.
Adjusting the Graphed Data Density
You can also change the resolution of most of the dashboards in Grafana. This gives you the flexibility of graphing data points every 1 second, or averaged over 10, 30, 60 or more seconds. This makes it possible to graph a larger data range without truncating the graphs.
If this is available, it will be in the top left side of the dashboard.
Absolute Time Ranges
You can also manually set the range of time. To the left of the quick ranges, is a space for you to set the absolute time range.
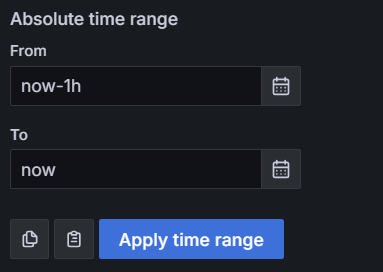
By clicking on the calendar icon, you can choose the desired date.
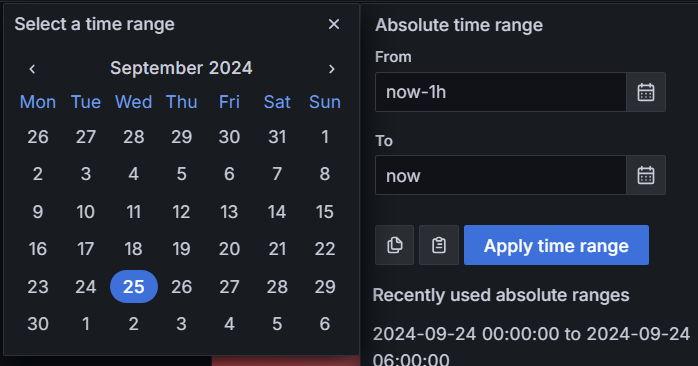
Double click on the desired date and it will automatically be filled into the time range on the right. Generally, this will start your time at 0000 on your desired date and end at 23:59:59.
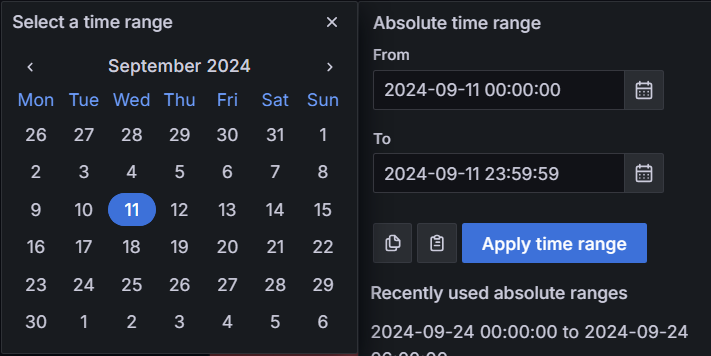
24 hrs is generally too large of a time range to properly graph in Grafana, so we suggest a time range of 6-12 hrs. Adjust the either the “from” or the “to” range to shorten the length.
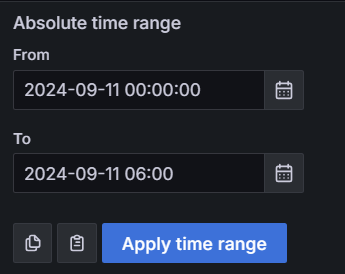
Click apply time range and the dashboard should load the new dataset.
Once an absolute time range is chosen, you can use the left and right arrows beside the time range to jump forward and backward in time your set time range. We find this is the most useful way to look for trends or certain events without knowing the exact timing.
