Data Pipeline
Data, files, and information are collected from sensors and computer systems and then written and/or moved to a central location. Depending on the individual system, and how data is captured, the route the data takes, as well as the structure of file containing the information differs. An overview of this system is described here.
Note: On the ship you can easily access some of the data described below through : http://10.23.9.25/
Ship Overview
Data Flow
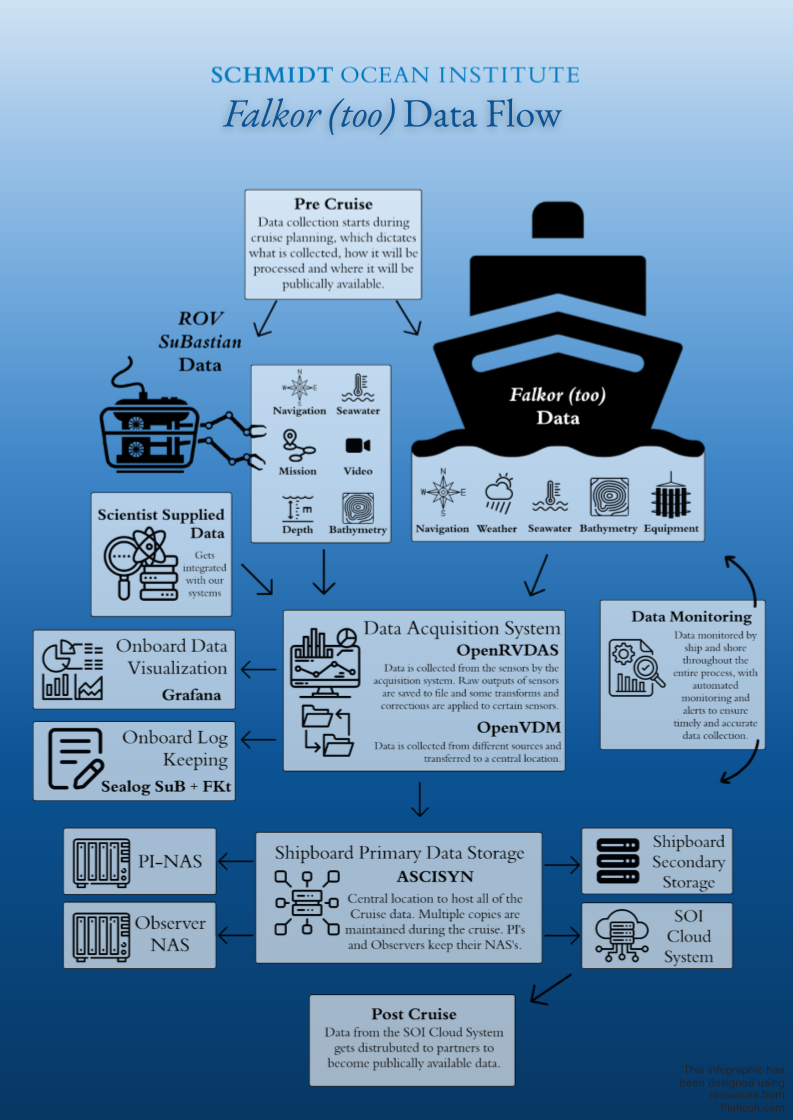
OpenRVDAS
“OpenRVDAS Open Research Vessel Data Acquisition System is a Python-based open source architecture intended to allow easy creation of customized data acquisition systems for research vessels and other scientific installations.”
OpenRVDAS is used aboard R/V Falkor (too) to gather and compile data from many systems. Each science sensor sends real time data to RVDAS, which grabs the data strings and prints to file. Files are created for each sensor, seperated further by date. In addition to recording raw data, RVDAS can also apply corrections to the raw data in real time, so we often utilize this program to add calibration coefficients or transforms to certain sensors.
During the cruise planning process, scientists can request to have their sensors integrated into our RVDAS system. This is generally done for sensors that either will be integrated onboard Falkor (too) for large periods of time or for when realtime graphical outputs are needed for a sensor.
OpenVDM
“OpenVDM Open Vessel Data Management is a ship-wide data management platform. It is comprised of a suite of programs and an accompanying web-application that provides vessel operators with a unified at-sea solution for retrieving and organizing files from multiple data acquisition systems into a unified cruise data package.”
- OpenVDM runs automatically to grab data files from many different acquisition systems throughout the cruise. Science parties are able to connect their aquistion computers to our system as well, allowing for distribution and backup of science party owned instruments and data. During this process, the system also syncs the full cruise data sets between several different storage devices, allowing for redundancy in cruise data backups.
InfluxDB
InfluxDB is an open source timeseries database used to capture real-time data and allow for redistribution, alerting, and interface aboard R/V Falkor (too).
- On R/V Falkor (too), openRVDAS receives the sensor data from the scientific instruments and InfluxDB stores the data in a database. Science parties dont typically interract directly with InfluxDB as it operates continuously in the background and is monitored and maintained by the shipboard technicians and our shoreside data team.
Grafana
Dashboarding software used to allow real-time data viewing on R/V Falkor (too)
- Grafana is a web based application that allows the science party to graphically view real time data in convenient and configurable pages. All of the sensors that log data through openRVDAS and InfluxDB are able to be visualized by Grafana. Scientists can submit requests for Grafana graphs during the cruise planning meetings or during the cruise. Grafana is able to be integrated into our EVERTZ video matrix system, allowing it to be displayed throughout the entire ship.
Data Products
For a detailed walkthrough of the CruiseData produced for every cruise, see the Data Directory.
Shore Overview
Data leaves the ship via a Google Transfer Appliance, a high capacity storage device that securely ships the data to a Google Upload Facility. Shortly after, the data gets uploaded to SOI’s Cloud System.
Cloud Infrastructure
SOI’s Cloud system acts as a data archive as well as a way to route data to a variety of locations to make the data publically available via public repositories.
Public Access
Schmidt Ocean Institute supports open sharing of information about the ocean to stimulate the growth of its applications and user community, and amplify further exploration, discovery, and deeper understanding of our environment. These efforts are supported through partnerships with data management experts in the oceanographic community to enable standards compliant sharing of scientific information and data collected during research cruises. Open data sharing is a core principle for SOI and part of our strategic framework for the next 10 years. We work with our science parties to ensure that within a certain period of time, all data collected is available publically.
Public Repositories
Data gets uploaded to several partners including R2R, Google Cloud and others.
R2R
Environmental sensor data routinely collected using embedded instrument systems on R/V Falkor (too) during research cruises and transits are made available to the general public via Schmidt Ocean Institute’s partnership with Rolling Deck to Repository (R2R). The datatypes curated by R2R can be found here, and are listed below:
- Acoustic Doppler Current Profiler measurements (ocean currents)
- Conductivity, Temperature, Pressure and other sensors of the water column
- Echosounder (depth to seafloor or midwater reflections, shallow sediment profiles, water column images)
- Expendable Probes (XBT, XCTD, XSV, XCP) launched from deck
- Fluorometer (fluorescence)
- Gravimeter (gravity field)
- Magnetometer (magnetic field)
- Meteorological Data (wind speed/direction, temperature, humidity, turbulence, precipitation, radiation)
- Multibeam (unprocessed, swath bathymetry, amplitude, backscatter, water column image)
- Navigation Data (time, position, Global Navigation Satellite System, Vertical Reference Unit, Speed Log,Gyrocompas)
- Sea surface sound velocimeter (SSV)
- Thermosalinograph (TSG – flowthrough temperature and salinity)
- Winch (wire tension, speed, payout)